
Measuring product success is one of the most critical—and challenging—responsibilities of product managers, founders, and growth leaders. Modern digital products generate an overwhelming amount of data: traffic numbers, clicks, sessions, feature usage, conversions, churn, revenue, and countless other indicators. The real challenge is not collecting data, but making sense of it.
To address this problem, Dave McClure, founder of 500 Startups, introduced the AARRR metrics framework, commonly known as Pirate Metrics (because it sounds like “Arrr!”). This framework provides a simple yet powerful way to structure product metrics around the user lifecycle, from the moment a user discovers your product to the moment they generate revenue—and ideally bring other users with them.
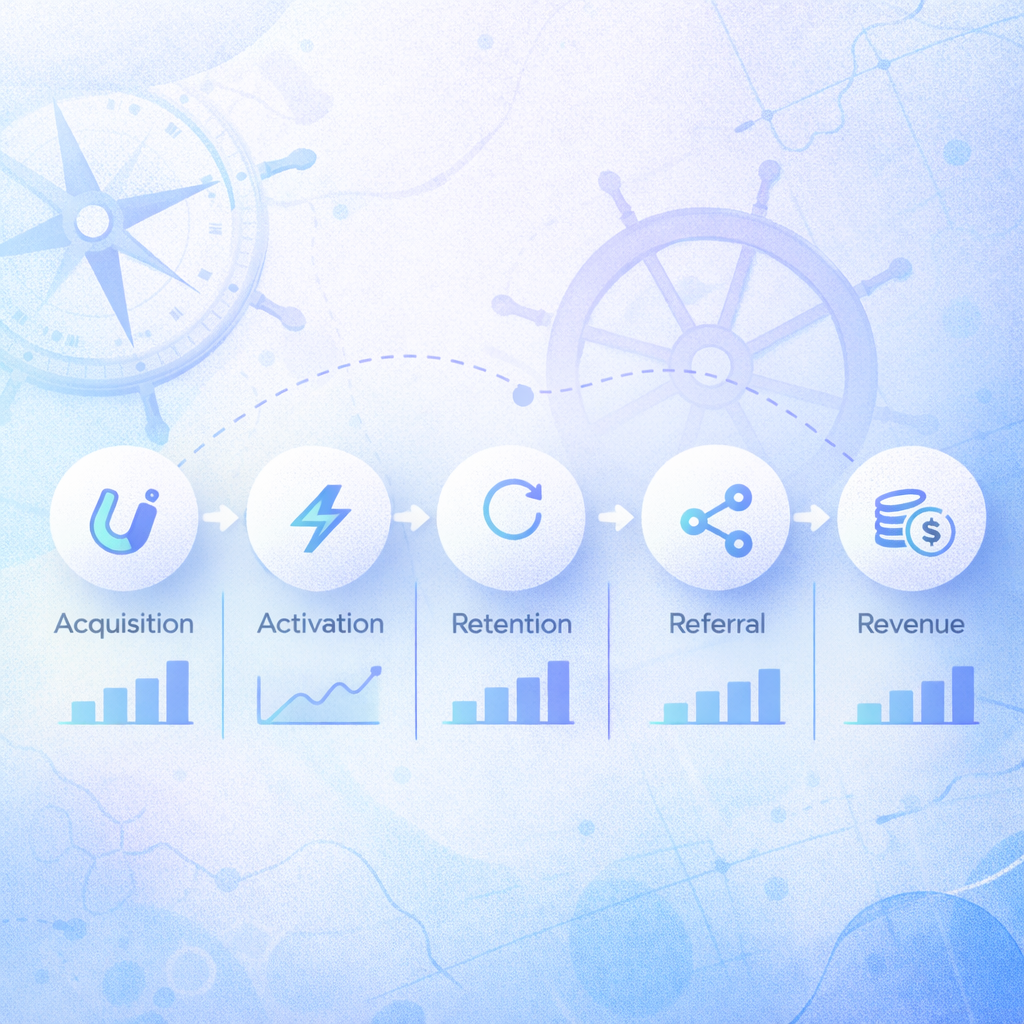
The AARRR framework is especially popular among software, SaaS, and service-based businesses, but its principles apply to almost any digital product. By breaking the customer journey into five clear stages—Acquisition, Activation, Retention, Referral, and Revenue—AARRR helps teams focus on what truly matters at each step and avoid vanity metrics that look good but provide little insight.
This article explores the AARRR framework in depth, explains each stage, and provides practical examples of metrics you can use to evaluate how your product is performing across the entire user journey.
1. What Is the AARRR (Pirate) Metrics Framework?
The AARRR framework is a lifecycle-based approach to metrics. Instead of looking at isolated KPIs, it encourages teams to think in terms of progression: how users move from one stage to the next.
The five stages are:
- Acquisition – How users find your product
- Activation – Whether users experience initial value
- Retention – Whether users return over time
- Referral – Whether users recommend your product
- Revenue – Whether users generate income
Each stage answers a critical business question:
- Are people discovering us?
- Are they actually using the product?
- Do they keep coming back?
- Do they like it enough to tell others?
- Are we making money?
By answering these questions with the right metrics, teams gain clarity about product health and growth opportunities.
2. Why AARRR Is So Widely Used
The popularity of the AARRR framework comes from several strengths:
a) It is simple and intuitive
Anyone—from engineers to executives—can understand the five stages quickly.
b) It is customer-centric
The framework mirrors how users experience a product, not how teams organize internally.
c) It supports prioritization
AARRR helps teams identify where the biggest bottleneck is and focus improvement efforts accordingly.
d) It aligns metrics with growth
Instead of tracking everything, teams track what matters most at each stage.
Importantly, AARRR is not about tracking dozens of metrics. It is about choosing the right metrics for each stage.
3. Acquisition: How Users Find Your Product
What Acquisition Measures
Acquisition metrics answer the question:
How do users discover and reach your product?
This stage focuses on awareness, reach, and initial traffic generation.
Common Acquisition Metrics
- Website visitors
- App installs
- Sign-up page visits
- Click-through rate (CTR)
- Customer acquisition cost (CAC)
- Cost per click (CPC)
- Conversion rate from visitor to sign-up
Why Acquisition Metrics Matter
Without acquisition, nothing else matters. No activation, no retention, no revenue.
However, acquisition alone is meaningless if users do not activate or return. High traffic with low activation is often a sign of poor targeting or unclear value proposition.
Key Insight
Good acquisition metrics are not just about volume—they are about quality of traffic. A smaller number of highly relevant users is often more valuable than a large number of unqualified visitors.
4. Activation: The First Moment of Value
What Activation Measures
Activation metrics show whether users experience their first meaningful interaction with your product—often referred to as the “aha moment.”
Activation answers the question:
Did the user actually experience value?
Examples of Activation Events
- Completing onboarding
- Creating the first project
- Sending the first message
- Uploading the first file
- Making the first transaction
Common Activation Metrics
- Activation rate (activated users ÷ new users)
- Onboarding completion rate
- Time to first key action
- Percentage of users reaching the “aha moment”
Why Activation Metrics Matter
Many products lose users immediately after sign-up. If users don’t understand the value quickly, they leave—and often never return.
Activation metrics help teams:
- Improve onboarding
- Simplify first-time experiences
- Reduce friction
- Clarify value propositions
Key Insight
A sign-up is not success.
Activation is success.
5. Retention: Do Users Come Back?
What Retention Measures
Retention metrics indicate whether users return to your product after their initial experience.
Retention answers the question:
Is the product valuable enough to become part of the user’s routine?
Common Retention Metrics
- Daily Active Users (DAU)
- Weekly Active Users (WAU)
- Monthly Active Users (MAU)
- Retention rate (Day 1, Day 7, Day 30)
- Churn rate
- Frequency of usage
Why Retention Is Critical
Retention is often considered the most important metric in the AARRR framework.
A product with strong retention:
- Has product–market fit
- Grows more sustainably
- Has lower acquisition costs over time
- Generates higher lifetime value
A product with poor retention is essentially “leaking users,” no matter how strong acquisition is.
Key Insight
If users don’t come back, growth is an illusion.
6. Referral: Do Users Recommend Your Product?
What Referral Measures
Referral metrics evaluate whether users are happy enough to invite or recommend your product to others.
Referral answers the question:
Do users like the product enough to share it?
Common Referral Metrics
- Number of invitations sent
- Referral conversion rate
- Viral coefficient
- Net Promoter Score (NPS)
- Share rate
Why Referral Metrics Matter
Referrals are powerful because they:
- Reduce acquisition costs
- Increase trust (recommendations are social proof)
- Create compounding growth effects
However, referrals only work if users are genuinely satisfied. You cannot force virality.
Key Insight
Referrals are a byproduct of value, not a feature.
7. Revenue: Are You Making Money?
What Revenue Measures
Revenue metrics assess whether your product generates financial value.
Revenue answers the question:
Is the business sustainable?
Common Revenue Metrics
- Monthly Recurring Revenue (MRR)
- Annual Recurring Revenue (ARR)
- Average Revenue Per User (ARPU)
- Lifetime Value (LTV)
- Conversion rate to paid plans
- Purchase frequency
- Average order value
Why Revenue Metrics Matter
Revenue turns usage into sustainability. Even products that start free eventually need a clear path to monetization.
Revenue metrics also influence:
- Pricing strategy
- Feature prioritization
- Customer segmentation
- Business valuation
Key Insight
Revenue validates that the product delivers enough value for users to pay.
8. How to Use AARRR Effectively in Practice
Step 1: Identify Your Core Funnel
Map your user journey clearly from acquisition to revenue.
Step 2: Define One or Two Key Metrics per Stage
Avoid tracking too many metrics. Focus on what truly signals progress.
Step 3: Identify Bottlenecks
Where do users drop off?
- High acquisition but low activation?
- Good activation but poor retention?
- Strong retention but weak monetization?
Step 4: Prioritize Improvements
Fix the biggest bottleneck before optimizing other stages.
Step 5: Review Metrics Regularly
AARRR metrics should evolve as your product matures.
9. Common Mistakes When Using AARRR
- Treating all stages as equally important at all times
- Focusing on acquisition while ignoring retention
- Measuring vanity metrics instead of behavioral outcomes
- Applying AARRR rigidly without adapting to the product context
AARRR is a guide, not a rulebook.
10. Conclusion: AARRR as a Growth Mindset
The AARRR (Pirate) metrics framework is more than a checklist of KPIs—it is a way of thinking about growth through the lens of user value.
By structuring metrics around Acquisition, Activation, Retention, Referral, and Revenue, teams gain a holistic view of product performance and a practical way to identify what needs improvement.
When used thoughtfully, AARRR helps teams:
- Focus on meaningful outcomes
- Align product and business goals
- Build sustainable, user-centered growth
Ultimately, the strength of AARRR lies in its simplicity:
If users find value, they stay, they share, and they pay.
And metrics should always help you understand whether that is truly happening.
You may also like: Tracking Your Metrics in Practice: How to Measure, Monitor, and Evolve Metrics in the Real World
Reach a global audience of portfolio, program, and project managers, product leaders, and certification professionals. Explore advertising opportunities .
Sponsored