
Product metrics can easily become overwhelming. With endless data available—engagement metrics, behavioral signals, conversion rates, operational KPIs—product managers often struggle to determine which metrics matter most and how to structure them meaningfully. This challenge grows as products scale, teams expand, and businesses diversify their lines of value.
To solve this, Google introduced one of the most influential frameworks in product management: the HEART Framework. Originally developed by Kerry Rodden and collaborators at Google, the HEART framework helps product teams evaluate user experience and product success across five key categories: Happiness, Engagement, Adoption, Retention, and Task Success.
This article, the fifth in our series, explores the HEART framework in depth. We’ll discuss how it works, how to apply it, how to define goals, signals, and metrics for each category, and why it remains one of the most flexible and powerful measurement tools available to product teams.
1. What Is the HEART Framework?
The HEART framework is a structured way to think about user behavior, user satisfaction, and product performance across the full customer journey. It helps PMs identify the most important metrics for understanding the health and success of a product.
HEART stands for:
- Happiness
- Engagement
- Adoption
- Retention
- Task Success
Each dimension focuses on a different aspect of how users experience value. Together, they provide a holistic view of product health—beyond vanity metrics or fragmented KPIs.
The HEART framework is typically implemented using a three-column structure:
- Goals: What do you want to happen?
- Signals: What user behaviors indicate progress toward the goal?
- Metrics: How do you quantify the signals over time?
This structured approach ensures clarity, alignment, and accountability.
2. Why the HEART Framework Works
The HEART framework remains popular because:
a) It centers on the user
Instead of beginning with business outcomes, HEART starts with how users feel and behave within the product.
b) It connects qualitative experience with quantitative metrics
HAPPY users…
ENGAGE more…
ADOPT more features…
RETENTION increases…
TASK SUCCESS improves.
HEART links these dimensions in a measurable framework.
c) It is flexible across product types
A consumer app, SaaS product, e-commerce website, or enterprise platform—all can use HEART.
d) It prevents teams from over-focusing on a single metric
By considering all five dimensions, PMs avoid blind spots and understand the full customer journey.
e) It supports reporting—not exploration
The HEART framework is ideal for ongoing tracking of product health (via reporting metrics), not for exploratory analytics or debugging.
3. Understanding Each Dimension of HEART
Let’s break down the five categories and what they mean.
1. Happiness
Happiness measures how satisfied users are with the product.
Examples:
- Net Promoter Score (NPS)
- App store ratings
- Customer satisfaction scores
- Sentiment in surveys or reviews
Happiness is a leading indicator—it signals shifts in user sentiment before retention or engagement metrics change.
2. Engagement
Engagement measures how users interact with the product in the short term.
Examples:
- number of sessions per user
- amount of content consumed
- likes, shares, posts
- messages sent
- tasks completed
Engagement metrics vary widely depending on the product type, but they always capture the frequency and intensity of use.
3. Adoption
Adoption measures how many new users try your product or new features.
Examples:
- percentage of new users who complete onboarding
- number of installs or sign-ups
- first-time feature usage
- activation rate
Adoption is crucial when launching a new product or new functionality.
4. Retention
Retention measures how many users return over time.
Examples:
- percentage of users returning after one day (D1 retention)
- percentage returning after one week or month
- churn rate
Retention shows long-term value delivery and is strongly linked to product-market fit.
5. Task Success
Task success measures how effectively users complete the key action your product is built for.
Examples:
- task completion rate
- time to complete a task
- error rate
- number of failed attempts
This is especially important for transactional products, workflows, and productivity tools.
4. Applying the HEART Framework: Goals, Signals, Metrics
The HEART framework becomes powerful when PMs articulate Goals, Signals, and Metrics for each dimension.
Let’s walk through this using a hypothetical product example:
Uber for Specialty Coffee Delivery.
H — Happiness
Goal:
Maximize customer satisfaction with the coffee quality and delivery experience.
Signals:
- positive app store reviews
- high NPS from user surveys
Metrics:
- app store rating change month-over-month
- percentage of users giving a score of 9 or 10 on NPS
E — Engagement
Goal:
Increase the number of orders and total order value.
Signals:
- more orders per customer
- higher order value per customer
Metrics:
- average order value per day
- average number of orders per user per day
A — Adoption
Goal:
Increase the number of users who try the product at least once.
Signals:
- number of users who download and open the app
- number of users who place their first order
Metrics:
- % of new users → first-time customers
- % of new users completing onboarding
R — Retention
Goal:
Increase repeat orders from existing customers.
Signals:
- returning users
- number of users who order monthly
Metrics:
- retained users (month over month)
- retention rate (% of users who ordered last month and order again this month)
T — Task Success
Goal:
Make the ordering experience seamless and fast.
Signals:
- time from app open → order completion
- number of users who abandon checkout
Metrics:
- average time to checkout
- % of incomplete orders per month
5. Tips for Implementing the HEART Framework Effectively
Here are strategies used by high-performing product teams.
Tip 1: You don’t need to use all HEART dimensions
The framework is flexible.
Choose the dimensions most relevant to your product’s maturity and goals.
Example:
- A new product might focus on Adoption, Engagement, and Happiness.
- A mature product may focus heavily on Retention and Task Success.
Tip 2: Use the signals column to define tracking requirements
Signals help engineering teams determine what events need to be logged.
This avoids “we forgot to implement analytics for that feature” situations.
Tip 3: Keep metrics stable
HEART is meant for reporting, not for temporary analysis.
Avoid changing HEART metrics too frequently.
Stability reveals long-term trends.
Tip 4: Use HEART to support OKRs
HEART is compatible with OKRs:
- Objective: Improve user experience
- Key Results: HEART metrics (retention + task success + happiness)
This creates a strong alignment between strategic goals and measurable outcomes.
Tip 5: HEART works at multiple levels
You can use HEART for:
- the entire product
- a single feature
- a user journey
- a workflow
- a team’s area of ownership
This granular flexibility is one of its greatest strengths.
Tip 6: Use HEART as an antidote to vanity metrics
Because HEART is structured and user-centered, it keeps teams focused on metrics that matter—not flashy numbers like downloads or pageviews.
6. Why HEART Works Better Than Many Other Frameworks
Many frameworks focus solely on business performance or technical health.
Others attempt to measure everything but lack structure.
HEART succeeds because:
- it is user-centered
- it is simple
- it provides consistency
- it encourages alignment
- it balances quantitative and qualitative insights
It gives PMs a way to communicate product health clearly and meaningfully.
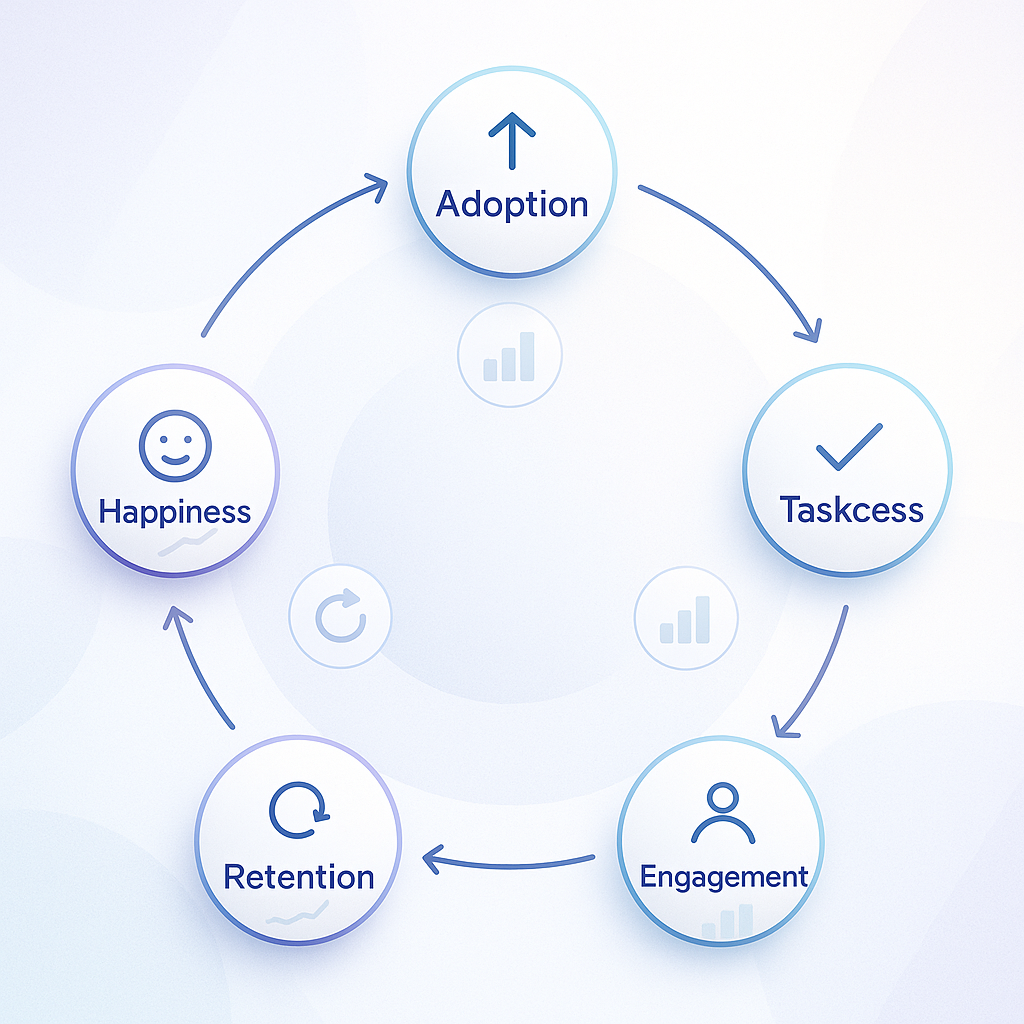
7. The Real Order of the User Journey: A.T.E.R.H.
Although HEART is listed as Happiness → Engagement → Adoption → Retention → Task Success, the real user journey usually follows:
- Adoption
- Task Success
- Engagement
- Retention
- Happiness
Why does this matter?
Because teams often mistakenly measure happiness before users have even completed a task.
Understanding the true order helps PMs design better onboarding, better flows, and better surveys.
8. Conclusion: HEART Makes Metrics Human
The HEART framework connects human behavior with business outcomes.
It encourages PMs to think beyond numbers and understand the full user experience.
With HEART, you can:
- measure what matters
- balance emotional and behavioral indicators
- monitor user experience holistically
- make data-informed decisions
- support product improvement through structure
In the next article, we will explore why the HEART framework is so powerful, how to apply it in complex environments, and how to use it to guide experimentation and product evolution.